YouTube Views Are Rising, But Long-Form Ad Revenue Is Falling. Here's Why That Matters
Last Updated:

Table of Content
Case Studies








Deepak Prajapat
Deepak Prajapat
Marketing Trends
Marketing Trends
8 Min Read
8 Min
A new report is highlighting a disconnect that should concern anyone using YouTube views as a proxy for success. Data from social media management platform Metricool shows that views on long-form YouTube videos climbed sharply over the past year, while the ad revenue tied to those same videos fell by roughly half.
The finding matters well beyond individual creators. Any business tracking video performance, whether for brand awareness, lead generation, or paid promotion, relies on the assumption that more views generally translate into more value. This report suggests that assumption needs a second look.
What Happened in the Report?
Metricool's analysis covers 799,718 long-form videos from 71,177 accounts connected to its platform, comparing February 2025 to February 2026. The company sells YouTube scheduling and reporting tools, so the dataset reflects accounts that use its software rather than the platform as a whole.
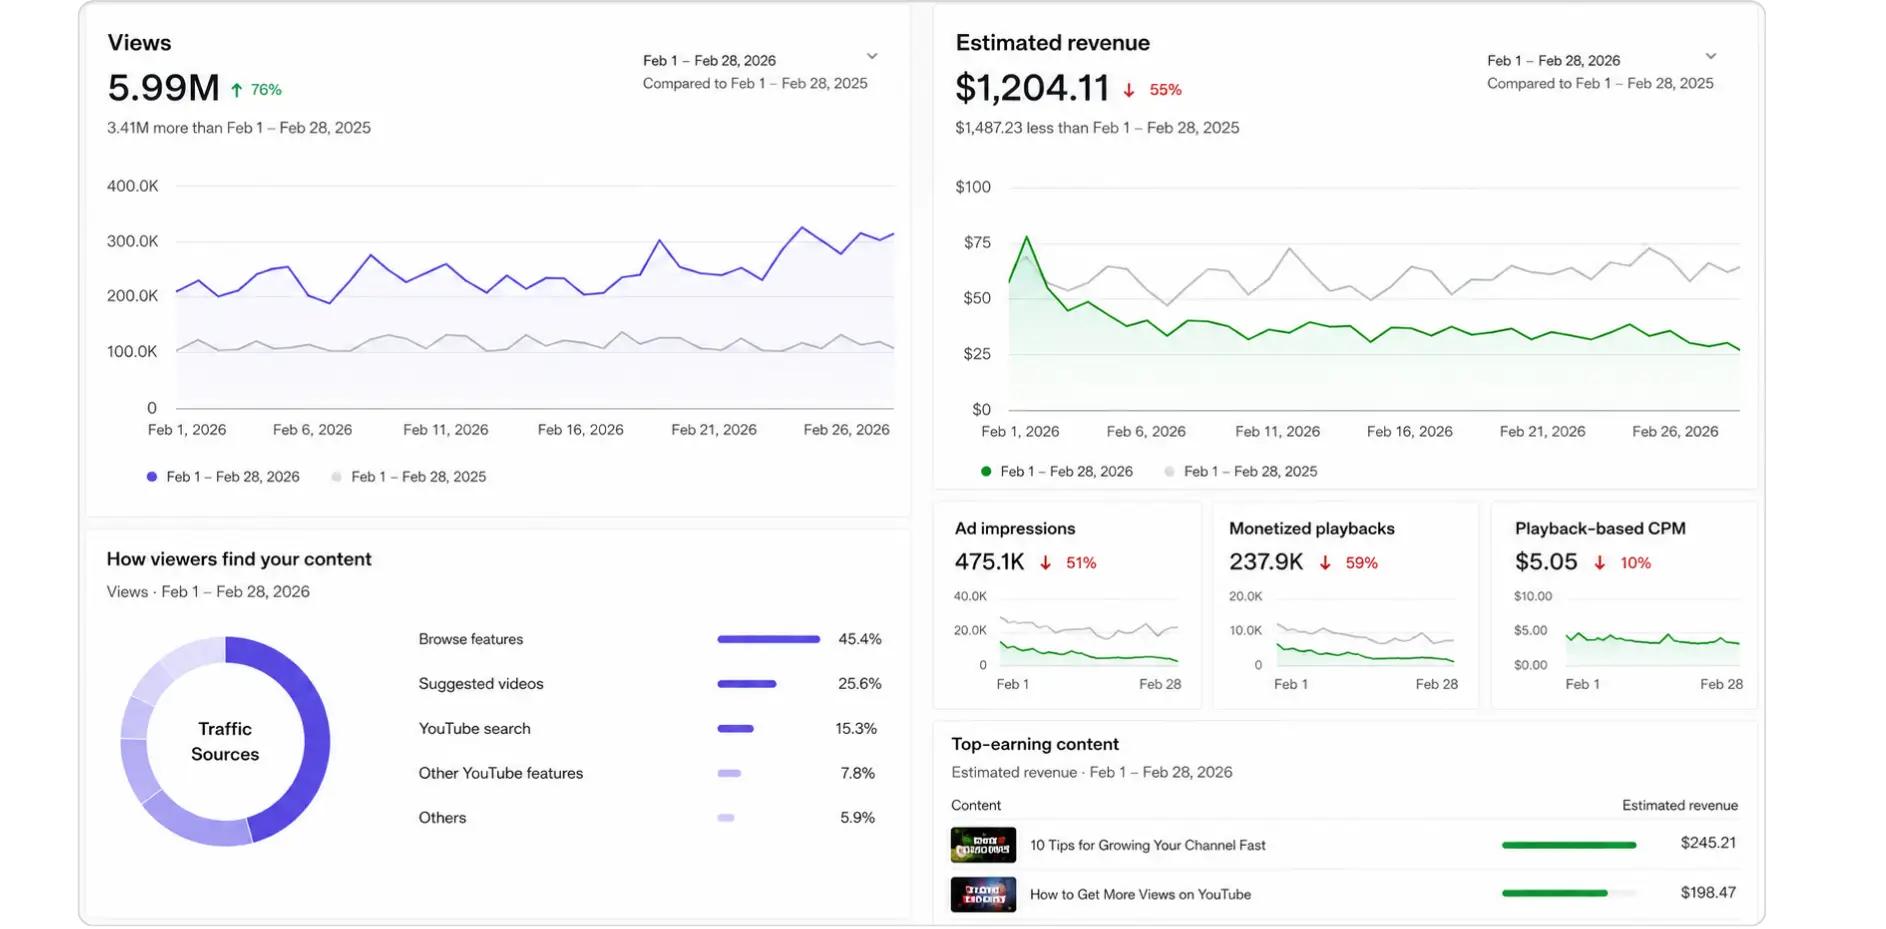
The headline number is striking: average views per long-form video rose from 3,405 to 5,985, a 76% increase. At the same time, average view duration dropped from 3.98 minutes to 2.51 minutes, a 37% decline. Viewers were showing up in far greater numbers, but sticking around for noticeably less time per visit.
That shorter attention span had a direct effect on monetization. Ad impressions per post fell from 976.32 to 475.07 & monetized playbacks, meaning views that actually had an ad run against them, dropped from 576.41 to 237.92. Estimated ad revenue per post fell from $2.65 to $1.20 & estimated YouTube Premium revenue per post dropped from $0.34 to $0.19.
Metricool ties the revenue decline to the drop in view duration. Shorter viewing sessions leave less room for mid-roll ads, which typically require a minimum watch time before they can appear. Interaction rates also fell, from 2.38% of views down to 1.30%, though total interactions per post only dipped slightly, from 81.14 to 77.93. That gap suggests the rate drop is mostly a function of more eyeballs spreading the percentage out, not a sign of less engagement overall.
It's worth noting what the report doesn't establish. It covers only two months a year apart, doesn't confirm whether the same accounts appear in both periods & excludes accounts with no activity or posts with zero impressions. There's no geographic breakdown either, which matters since ad rates vary significantly by viewer location.
Why Views and Revenue Can Move in Opposite Directions
Views measure reach. Revenue measures how much of that reach was actually monetized. Those are different things & this report shows just how far apart they can drift.
A view only becomes valuable to a channel's ad revenue if an ad was served and watched. If sessions are shorter, fewer videos hit the watch-time thresholds needed for pre-roll, mid-roll, or multiple ad placements. So, a channel can post a video that racks up far more views than the year before, while quietly earning less from that same video because fewer of those views ever encountered an ad.
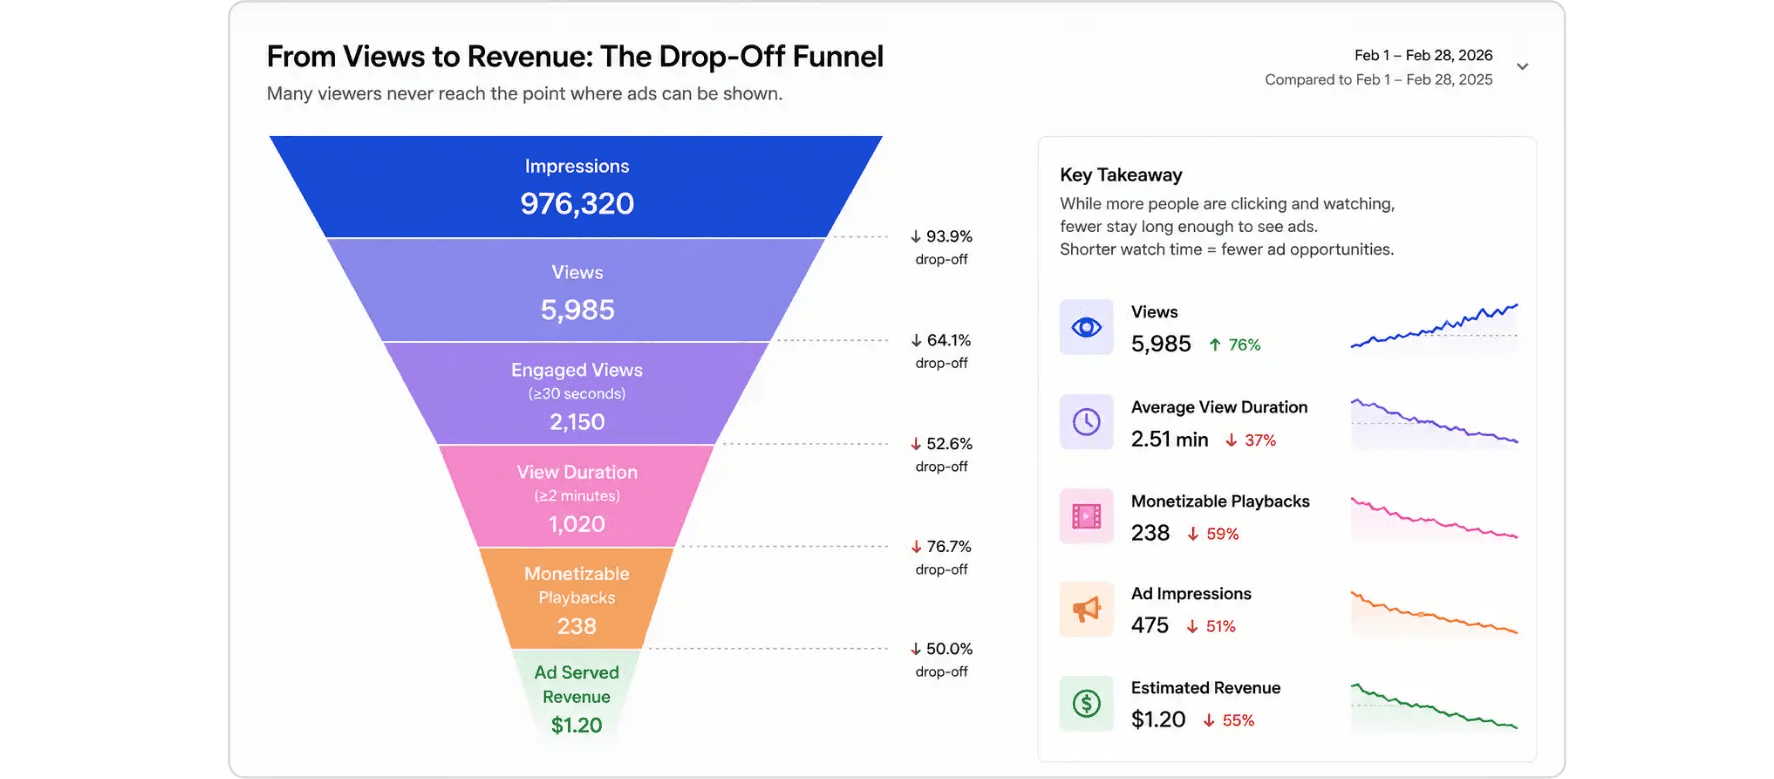
This is the core lesson: reach, engagement & monetization are three separate layers of performance. A number going up in one layer says nothing definitive about the others.
What This Means for Businesses and Marketers
The details vary by business type, but the underlying lesson is consistent: view counts alone don't tell you whether video content is doing its job.
An eCommerce brand running product videos should weigh watch time and click-throughs on calls to action more heavily than raw view counts, since a viewer who leaves before the CTA appears never had the chance to act on it.
A restaurant or local business using YouTube for visibility should track whether viewers stick around long enough to see a location, offer, or booking link, rather than treating a view as a completed impression.
SaaS companies publishing product demos or educational videos should watch drop-off points closely. High view counts on a tutorial mean little if most viewers exit before the feature explanation they came for.
Agencies and service-based businesses tend to be less concerned with total views and more concerned with qualified leads generated from video, since a large but shallow audience rarely converts to booked calls or signed contracts. Brands running paid video campaigns should consider monetized playback rates and ad delivery as separate line items from view totals when evaluating a campaign’s return.

What Marketers Should Learn From This Report
The report is a reminder to build video reporting around outcomes rather than a single headline metric. That means tracking view duration alongside view count, watching monetized playbacks and ad impressions rather than assuming they scale with views & comparing engagement metrics against revenue or conversion outcomes over time.
It also means watching for content fatigue signals, such as declining view duration even as views grow, which can indicate an audience skimming rather than watching. Analytics strategy, YouTube reporting & conversion tracking all become more useful when they're set up to catch these gaps early rather than after a quarter of underperformance has already passed.
Why Analytics Should Lead to Action
None of this data is useful sitting in a monthly report. The real value comes from using it to make decisions: which video formats deserve more budget, which content types hold attention longer, which audiences are more likely to convert & which videos need a stronger hook or a shorter intro to reduce early drop-off.
Key Takeaways
Long-form YouTube views surged 76% year-over-year in Metricool’s data, but average watch time declined 37%.
Ad impressions, monetized playbacks & estimated ad revenue all declined even as views increased.
Shorter viewing durations mean less opportunity for mid-roll advertising, which directly impacts profitability.
Views, engagement & revenue are separate performance layers that don't automatically move together.
In measuring success in businesses, views should be accompanied with watch time, click-throughs and conversions.
Video reporting should identify drop-off spots and weariness signals early, not just count totals.
Decisions about budget and content strategy should be based on revenue and retention data, not view counts alone.
Final Thoughts
YouTube views should never be judged in isolation. This report is a useful case study in how a metric that looks like growth can mask a decline happening one layer deeper. Businesses that pair view data with watch time, monetization figures & conversion outcomes are in a far better position to make informed decisions about where to invest in video & where to adjust course.
FAQs
Why do YouTube views go up while ad revenue go down?

Someone is considered a viewer when they start to watch a video, not when they watch long enough for an ad to play. while average watch time falls, fewer sessions are eligible for ads & this can reduce revenue even while view counts are up.
What is monetized playback on YouTube?
A monetized replay is a view that was served an advertisement against. Some sessions conclude too fast or are on content not eligible for specific ad types and hence do not result in a monetized playback.
More viewing time = more revenue right?
More watch time = more chances for ads to show, especially mid-rolls. Revenue isn't just watch time, it's also ad availability, advertiser demand and viewer location. Watch time is one of several inputs.
How do you define video success for a business?
Success should be judged against the intent of the video, whether it was for brand exposure, lead generation or direct sales. We look at watch time, click through rate on calls to action and downstream conversions and we evaluate them as a whole rather than in isolation.
What other measures are there besides views?
Usually, metrics like view duration, engagement rate compared to view count, monetized playback rate and conversion or lead data are more indicative of how well the video content is functioning.
A new report is highlighting a disconnect that should concern anyone using YouTube views as a proxy for success. Data from social media management platform Metricool shows that views on long-form YouTube videos climbed sharply over the past year, while the ad revenue tied to those same videos fell by roughly half.
The finding matters well beyond individual creators. Any business tracking video performance, whether for brand awareness, lead generation, or paid promotion, relies on the assumption that more views generally translate into more value. This report suggests that assumption needs a second look.
What Happened in the Report?
Metricool's analysis covers 799,718 long-form videos from 71,177 accounts connected to its platform, comparing February 2025 to February 2026. The company sells YouTube scheduling and reporting tools, so the dataset reflects accounts that use its software rather than the platform as a whole.
The headline number is striking: average views per long-form video rose from 3,405 to 5,985, a 76% increase. At the same time, average view duration dropped from 3.98 minutes to 2.51 minutes, a 37% decline. Viewers were showing up in far greater numbers, but sticking around for noticeably less time per visit.
That shorter attention span had a direct effect on monetization. Ad impressions per post fell from 976.32 to 475.07 & monetized playbacks, meaning views that actually had an ad run against them, dropped from 576.41 to 237.92. Estimated ad revenue per post fell from $2.65 to $1.20 & estimated YouTube Premium revenue per post dropped from $0.34 to $0.19.
Metricool ties the revenue decline to the drop in view duration. Shorter viewing sessions leave less room for mid-roll ads, which typically require a minimum watch time before they can appear. Interaction rates also fell, from 2.38% of views down to 1.30%, though total interactions per post only dipped slightly, from 81.14 to 77.93. That gap suggests the rate drop is mostly a function of more eyeballs spreading the percentage out, not a sign of less engagement overall.
It's worth noting what the report doesn't establish. It covers only two months a year apart, doesn't confirm whether the same accounts appear in both periods & excludes accounts with no activity or posts with zero impressions. There's no geographic breakdown either, which matters since ad rates vary significantly by viewer location.
Why Views and Revenue Can Move in Opposite Directions
Views measure reach. Revenue measures how much of that reach was actually monetized. Those are different things & this report shows just how far apart they can drift.
A view only becomes valuable to a channel's ad revenue if an ad was served and watched. If sessions are shorter, fewer videos hit the watch-time thresholds needed for pre-roll, mid-roll, or multiple ad placements. So, a channel can post a video that racks up far more views than the year before, while quietly earning less from that same video because fewer of those views ever encountered an ad.
This is the core lesson: reach, engagement & monetization are three separate layers of performance. A number going up in one layer says nothing definitive about the others.
What This Means for Businesses and Marketers
The details vary by business type, but the underlying lesson is consistent: view counts alone don't tell you whether video content is doing its job.
An eCommerce brand running product videos should weigh watch time and click-throughs on calls to action more heavily than raw view counts, since a viewer who leaves before the CTA appears never had the chance to act on it.
A restaurant or local business using YouTube for visibility should track whether viewers stick around long enough to see a location, offer, or booking link, rather than treating a view as a completed impression.
SaaS companies publishing product demos or educational videos should watch drop-off points closely. High view counts on a tutorial mean little if most viewers exit before the feature explanation they came for.
Agencies and service-based businesses tend to be less concerned with total views and more concerned with qualified leads generated from video, since a large but shallow audience rarely converts to booked calls or signed contracts. Brands running paid video campaigns should consider monetized playback rates and ad delivery as separate line items from view totals when evaluating a campaign’s return.
What Marketers Should Learn From This Report
The report is a reminder to build video reporting around outcomes rather than a single headline metric. That means tracking view duration alongside view count, watching monetized playbacks and ad impressions rather than assuming they scale with views & comparing engagement metrics against revenue or conversion outcomes over time.
It also means watching for content fatigue signals, such as declining view duration even as views grow, which can indicate an audience skimming rather than watching. Analytics strategy, YouTube reporting & conversion tracking all become more useful when they're set up to catch these gaps early rather than after a quarter of underperformance has already passed.
Why Analytics Should Lead to Action
None of this data is useful sitting in a monthly report. The real value comes from using it to make decisions: which video formats deserve more budget, which content types hold attention longer, which audiences are more likely to convert & which videos need a stronger hook or a shorter intro to reduce early drop-off.
Key Takeaways
Long-form YouTube views surged 76% year-over-year in Metricool’s data, but average watch time declined 37%.
Ad impressions, monetized playbacks & estimated ad revenue all declined even as views increased.
Shorter viewing durations mean less opportunity for mid-roll advertising, which directly impacts profitability.
Views, engagement & revenue are separate performance layers that don't automatically move together.
In measuring success in businesses, views should be accompanied with watch time, click-throughs and conversions.
Video reporting should identify drop-off spots and weariness signals early, not just count totals.
Decisions about budget and content strategy should be based on revenue and retention data, not view counts alone.
Final Thoughts
YouTube views should never be judged in isolation. This report is a useful case study in how a metric that looks like growth can mask a decline happening one layer deeper. Businesses that pair view data with watch time, monetization figures & conversion outcomes are in a far better position to make informed decisions about where to invest in video & where to adjust course.
FAQs
Why do YouTube views go up while ad revenue go down?
Someone is considered a viewer when they start to watch a video, not when they watch long enough for an ad to play. while average watch time falls, fewer sessions are eligible for ads & this can reduce revenue even while view counts are up.
What is monetized playback on YouTube?
A monetized replay is a view that was served an advertisement against. Some sessions conclude too fast or are on content not eligible for specific ad types and hence do not result in a monetized playback.
More viewing time = more revenue right?
More watch time = more chances for ads to show, especially mid-rolls. Revenue isn't just watch time, it's also ad availability, advertiser demand and viewer location. Watch time is one of several inputs.
How do you define video success for a business?
Success should be judged against the intent of the video, whether it was for brand exposure, lead generation or direct sales. We look at watch time, click through rate on calls to action and downstream conversions and we evaluate them as a whole rather than in isolation.
What other measures are there besides views?
Usually, metrics like view duration, engagement rate compared to view count, monetized playback rate and conversion or lead data are more indicative of how well the video content is functioning.



Summarize with AI

Latest Blogs







Want to be seen everywhere?
Get a free AI-search audit Today!



4.9/5 Ratings!


Don’t miss our revenue growth tips!
Get expert marketing tips—straight to your inbox, like thousands of happy clients.
Don’t miss our revenue growth tips!
Get expert marketing tips—straight to your inbox, like thousands of happy clients.
Don’t miss our revenue growth tips!
Don’t miss our revenue growth tips!
Get expert marketing tips—straight to your inbox, like thousands of happy clients.
Explore News, Updates & Strategies
Explore News, Updates & Strategies
Explore the latest industry updates, marketing trends, Google changes, expert insights, success stories, eCommerce strategies, AEO innovations, and lead generation techniques — all in one place.
Explore the latest industry updates, marketing trends, Google changes, expert insights, success stories, eCommerce strategies, AEO innovations, and lead generation techniques — all in one place.

Google Updates
Sep 26, 2026
3 Min Read
Google Search Console Adds Multimodal Search Performance Reporting
Google Updates
Sep 26, 2026
3 Min Read
Google Search Console Adds Multimodal Search Performance Reporting
Google Updates
Sep 26, 2026
3 Min Read
Google Search Console Adds Multimodal Search Performance Reporting

Google Updates
Sep 2, 2026
5 Min Read
Google Search Console's Generative AI Performance Report Goes Fully Global
Google Updates
Sep 2, 2026
5 Min Read
Google Search Console's Generative AI Performance Report Goes Fully Global
Google Updates
Sep 2, 2026
5 Min Read
Google Search Console's Generative AI Performance Report Goes Fully Global

Google Updates
Aug 18, 2026
5 Min Read
Google’s August 2026 Spam Update: Who Won, Who Lost & Why?
Google Updates
Aug 18, 2026
5 Min Read
Google’s August 2026 Spam Update: Who Won, Who Lost & Why?
Google Updates
Aug 18, 2026
5 Min Read
Google’s August 2026 Spam Update: Who Won, Who Lost & Why?




































Ready to speak with an expert?
Data-Driven Marketing Agency That Elevates ROI
1100+
Websites Designed & Optimized to Convert
$280M+
Client Revenue Driven & Growing Strong
Discover how to skyrocket
your revenue today!
Trusted by 1000+ Owners!
Ready to speak with an expert?
Data-Driven Marketing Agency That Elevates ROI
1100+
Websites Designed & Optimized to Convert
$280M+
Client Revenue Driven & Growing Strong
Discover how to skyrocket
your revenue today!
Trusted by 1000+ Owners!
Want to skyrocket revenue?
4.9/5 Ratings!
Ready to speak with an expert?
Data-Driven Marketing Agency That Elevates ROI
1100+
Websites Designed & Optimized to Convert
$280M+
Client Revenue Driven & Growing Strong
Discover how to skyrocket
your revenue today!
Trusted by 1000+ Owners!
Call
Meet