Is Your Website Too Slow? Here's How to Fix It
Is Your Website Too Slow? Here's How to Fix It
Last Updated:
Table of Content
Client Testimonials















Nikhil Burani
Nikhil Burani
Nikhil Burani
Web Design
Web Design
Web Design
10 Min Read
10 Min
10 Min Read
Is your website too slow? Probably. And you already know, even if you have not looked at a single performance report. That page that takes a breath before the text appears. The form you click twice because the button has not woken up yet. The mobile visitor who was looking at your prices and is now reading a competitor's blog.
Most business owners answer this question with a feeling. This guide gives you a different answer: a diagnosis you can run in five minutes, the seven causes that produce almost every slow site, a 30-day fix order, and the reason speed matters more in 2026 than it did five years ago. Most of what slows a site down was decided while it was being built, which is why speed belongs inside web design rather than in a cleanup pass at the end.
This is the same diagnostic loop our team uses on client sites at Coozmoo Digital Solutions, and it is built to be run by someone who has never opened Chrome DevTools. If you follow it, you will stop guessing and start fixing.
Is Your Website Too Slow? The 5-Minute Diagnostic
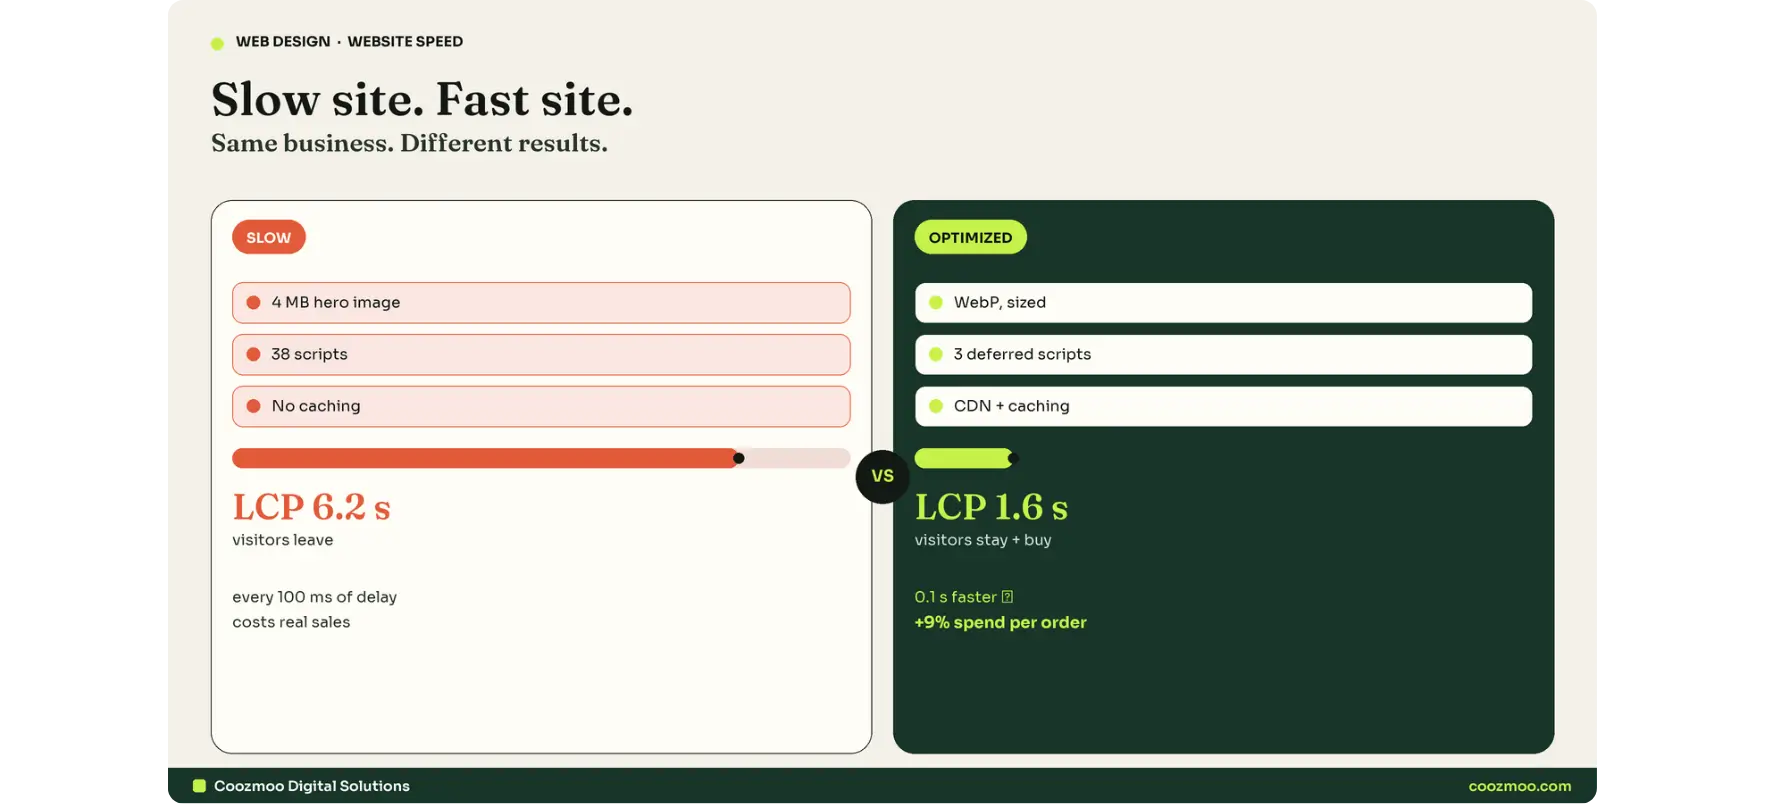
Do not start by deleting plugins. Start by measuring, because the fix that works for one slow site is useless on another. Two sites can both take six seconds to load. One has a 4 MB hero image. The other has a slow server and forty third-party scripts. The day-2 actions are completely different.
Here is the honest version of a speed test, because most guides skip it: there are two kinds of numbers, and only one of them counts.
Lab data comes from tools like PageSpeed Insights and Lighthouse. One simulated visit, fixed network, fixed device. Great for debugging, useless as a verdict.
Field data comes from real visitors on real phones, real wifi, and real 4G. Google collects it from Chrome users and publishes it in the Chrome User Experience Report. This is what Google's ranking systems actually look at.
That is why a site can score 98 in a lab test while customers still complain. Your test ran on a desktop connection. Your customers did not.
The numbers that matter
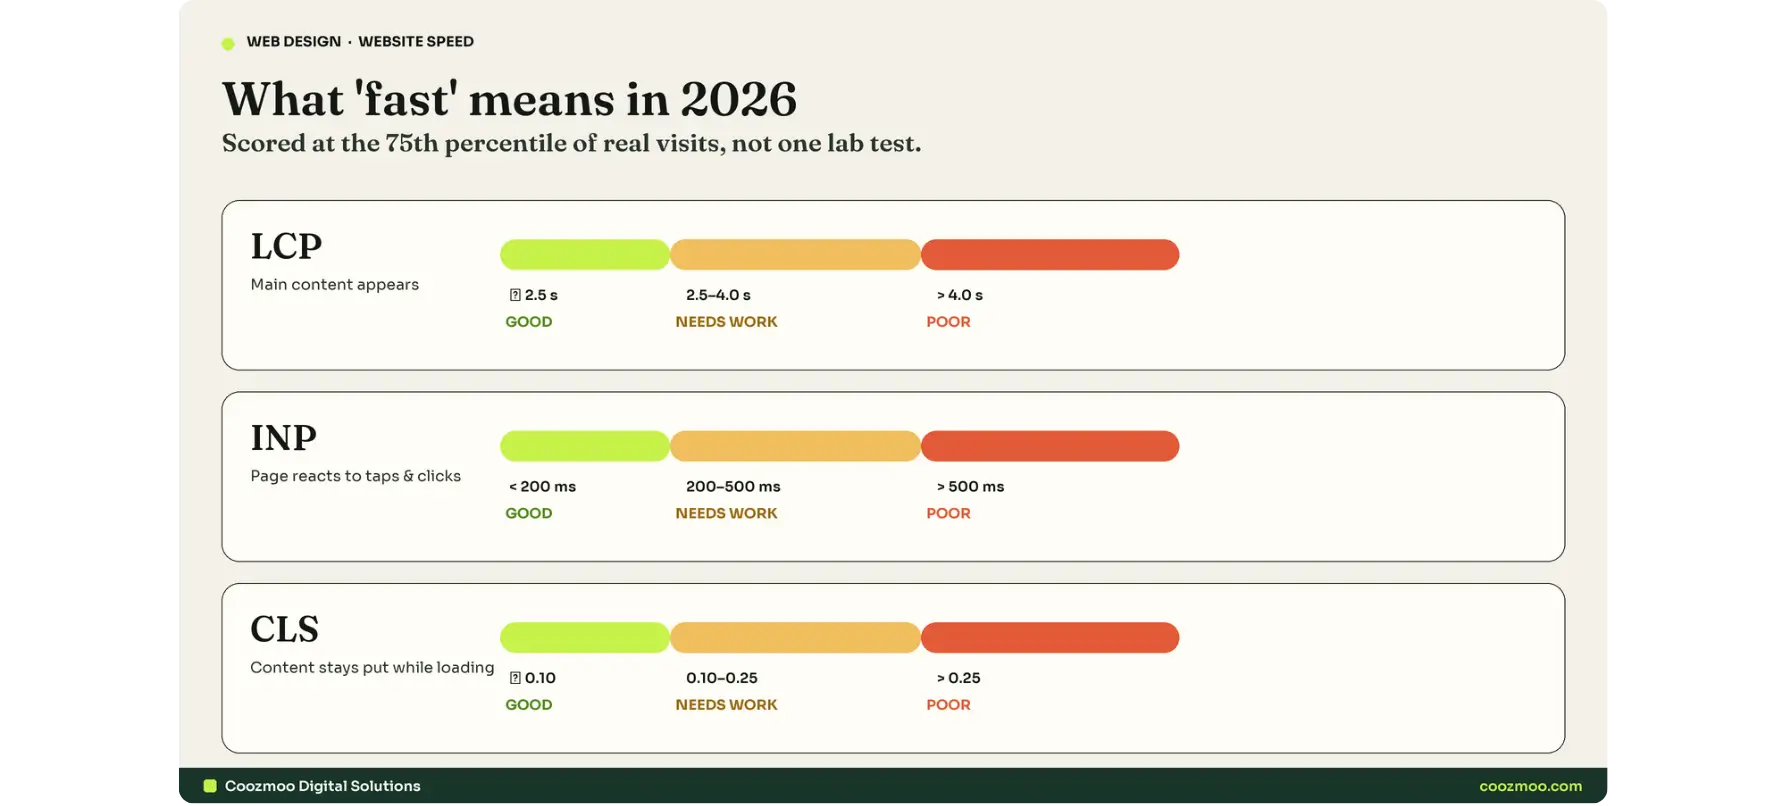
Google's Core Web Vitals are three measurements of how a page feels, not how heavy it is. Good means the metric passes for at least 75 percent of real page loads, so your slowest visitors are part of the score whether you like it or not.
Metric | What it measures | Good | Needs work | Poor |
|---|---|---|---|---|
LCP Largest Contentful Paint | How fast the main content appears | ≤ 2.5 s | 2.5–4.0 s | > 4.0 s |
INP Interaction to Next Paint | How fast the page reacts to taps and clicks | < 200 ms | 200–500 ms | > 500 ms |
CLS Cumulative Layout Shift | How much the layout jumps while loading | ≤ 0.10 | 0.10–0.25 | > 0.25 |
TTFB Time to First Byte | How fast the server answers | < 800 ms | 800–1,800 ms | higher |
FCP First Contentful Paint | When the first content shows | < 1.8 s | 1.8–3.0 s | higher |
One more thing to know, because it saves a lot of wasted effort: Google says page experience is not a magic ranking lever. Core Web Vitals are used by ranking systems, but a perfect score does not push thin content up the page. Speed is a support signal and a conversion problem, not a substitute for a good site. The people selling you "rank #1 by fixing PageSpeed" are selling you a score.
Run the snapshot
Open PageSpeed Insights on your homepage and your three most important pages. Note the Field data section first. If it says "no field data", the site does not have enough traffic yet, so use lab data as your baseline and check again in two weeks.
Open Search Console, go to Core Web Vitals, and sort by the number of URLs affected. Google is telling you which templates are the problem. If every slow URL is a product page, the fix is the product template, not the homepage.
On your phone, with wifi off, open your homepage and count. If the first real content is not there by the time you have read the word "hello", mobile visitors are leaving before your brand name loads.
That is your Snapshot. Write down the numbers. You will need them to prove the fix worked.

Want a second measurement from a different machine? Run the free page speed checker on the same URLs. Two tools disagreeing is normal. Two tools both saying "this is slow" is a problem.
Why Is Your Website Slow? The 7 Real Causes
Every slow website we audit fits into one of seven buckets. Almost every slow website fits into three or four.
If six seconds is disappearing somewhere, here is where the seconds actually go, and it is not one place. Google's own LCP optimization guide breaks the metric into four parts: the time before the important resource even starts loading, the download time for that resource, the delay before it can render, and the server's time to first byte. Speed problems hide in each of them.
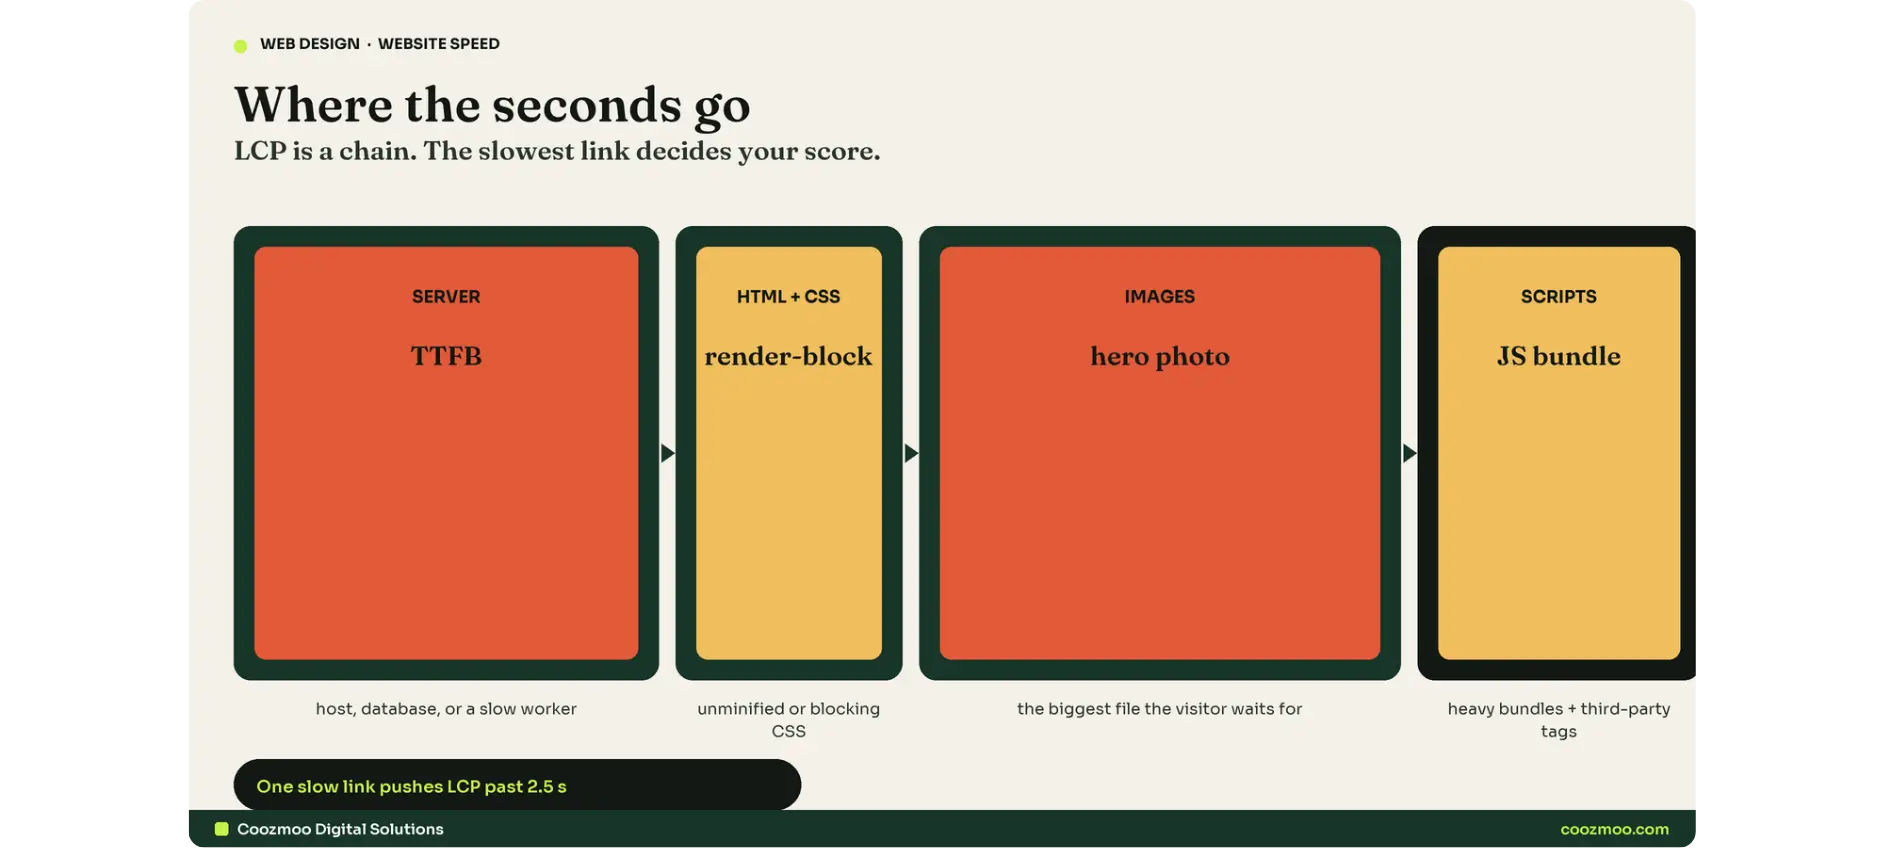
Now the seven causes, in the order we check them.
1. Images and video that are too big
The most common cause, and the easiest win. A 4,000-pixel-wide JPEG from a camera roll, served at 300 pixels wide, costs the visitor the full file size of the big one. Photographs should be served as WebP or AVIF, resized to the dimensions they actually display at, and usually under 200 KB. Product galleries and hero banners are where the money hides.
Metric attacked: LCP.
Owner: whoever uploads content.
2. JavaScript and third-party scripts
Every chat widget, analytics tag, ad pixel, review badge, and personalization script is a file your browser must download and run, and most of them run before your headline has a chance to show. Heavy JavaScript is the single biggest cause of poor INP, the metric that makes a page feel frozen after it has "loaded".
Metric attacked: INP mostly, LCP when scripts block rendering.
Owner: marketing operations plus development.
3. Hosting and server response
If your server takes 900 ms to answer, nothing you do to images will get you under 2.5 seconds. Shared hosting means your site shares resources with hundreds of others, and one neighbor's traffic spike can slow you down. Look for an average server response under 200 ms and a time to first byte under 800 ms.
Metric attacked: TTFB, which feeds LCP and FCP.
Owner: the host, then your developer.
4. Plugins, apps, and heavy themes
On WordPress, every active plugin adds code whether or not a visitor uses the feature. On Shopify, the same rule applies to apps. A theme with page transitions, sliders, and a bundled portfolio is rarely faster than a clean one. If a plugin or app does not measurably help revenue, it is a tax.
Metric attacked: everything, which is why app bloat is the classic "why is my website slow all of a sudden" answer.
Owner: site admin.
5. Web fonts
Custom fonts can block rendering until they download, and a badly configured font causes the text to swap mid-read, which is a layout shift. Subset the font to the characters you actually use, preload the ones above the fold, and set font-display: swap so readers see text immediately.
Metric attacked: LCP and CLS.
Owner: design plus development.
6. Missing caching and CDN
Browser caching stores static files on the visitor's device so repeat visits are nearly instant. A CDN stores copies of files on servers around the world so a visitor in Denver is not fetching from a server in Dallas or Dubai. Both are configuration, not code, and both are usually already included in modern platforms.
Metric attacked: LCP and TTFB for distant visitors.
Owner: host or platform.
7. Layout shock
Page layout shifts when an ad loads, a popup appears, a carousel spins, or an image has no reserved space. The visitor's finger is about to tap the "Book now" button and it moves down 40 pixels. The tap lands on something else. That is a CLS problem, and it is invisible in a screenshot but very visible in your form abandonment rate.
Metric attacked: CLS.
Owner: design plus whoever runs the popups.
What this looks like in one table?
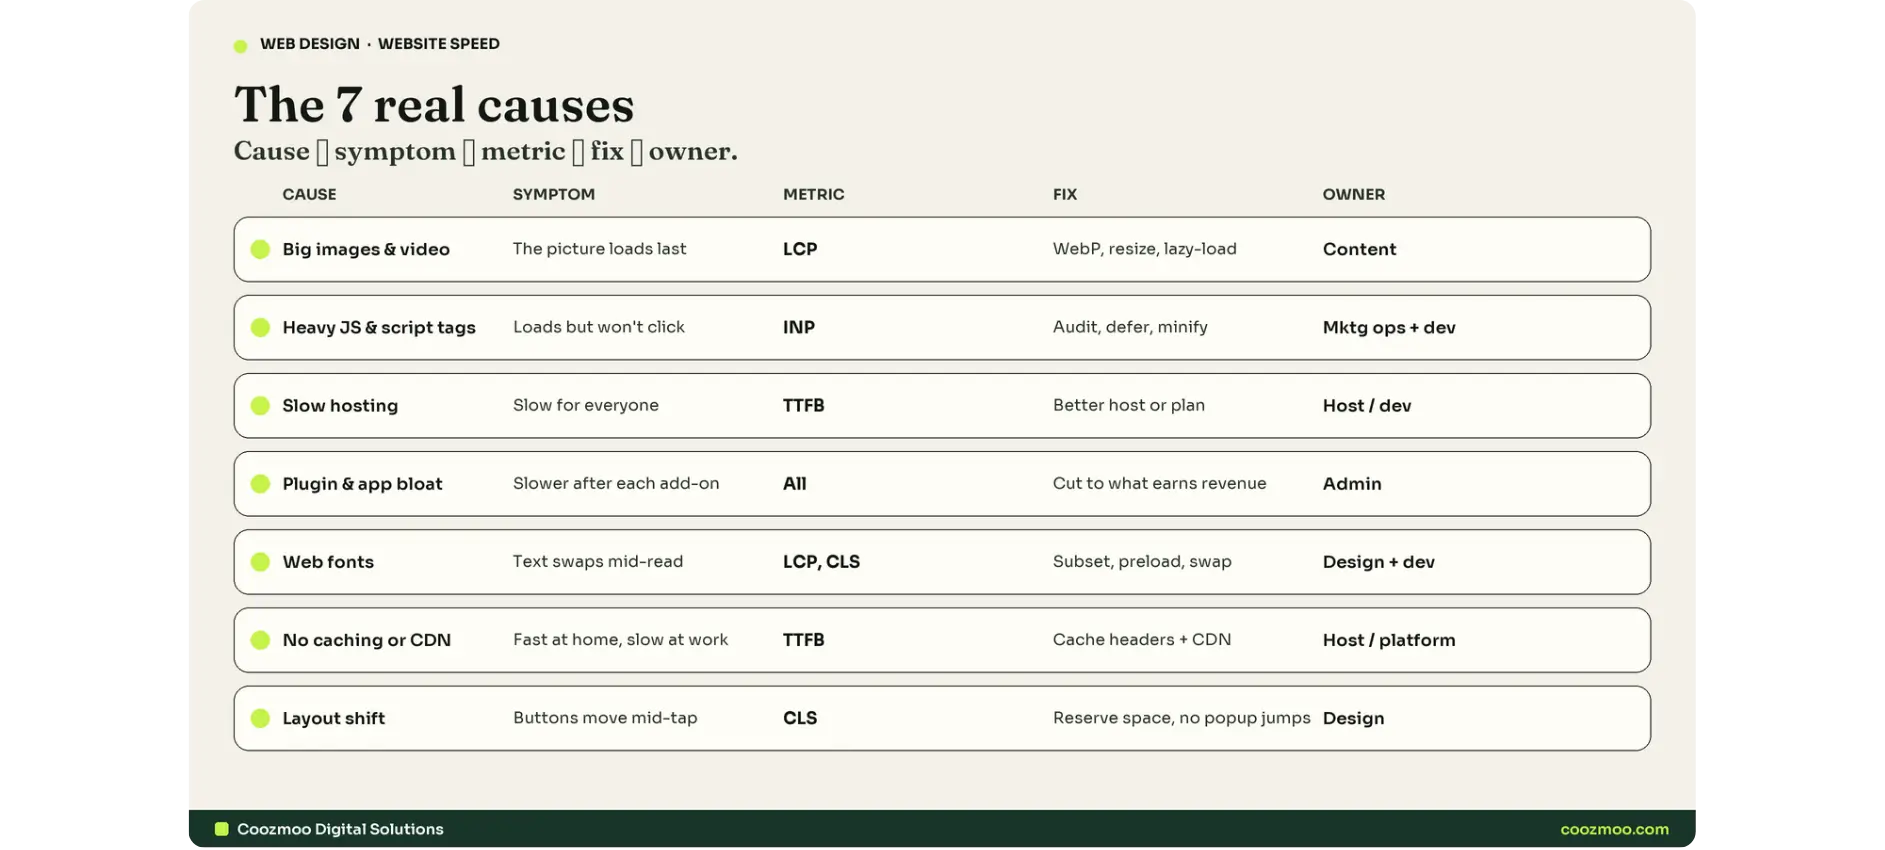
Cause | Symptom you will recognize | Metric | Owner |
|---|---|---|---|
Big images / video | "The picture is the last thing to load" | LCP | Content team |
Heavy JS / third-party scripts | "Page loads but I cannot click for 3 seconds" | INP | Marketing ops + dev |
Slow hosting | "It is slow for everyone, everywhere" | TTFB | Host / dev |
Plugin or app bloat | "It got slower after we added things" | All three | Site admin |
Web fonts | "Text appears then changes font" | LCP, CLS | Design + dev |
No caching / CDN | "Fast at home, slow at the office" | LCP, TTFB | Host / platform |
Layout shock | "Buttons move while I am clicking" | CLS | Design + popup owner |
How to Fix a Slow Website: The SPEED Method
Now the order. The order matters more than the list, because the biggest wins come from the delivery chain, not from deleting one plugin.
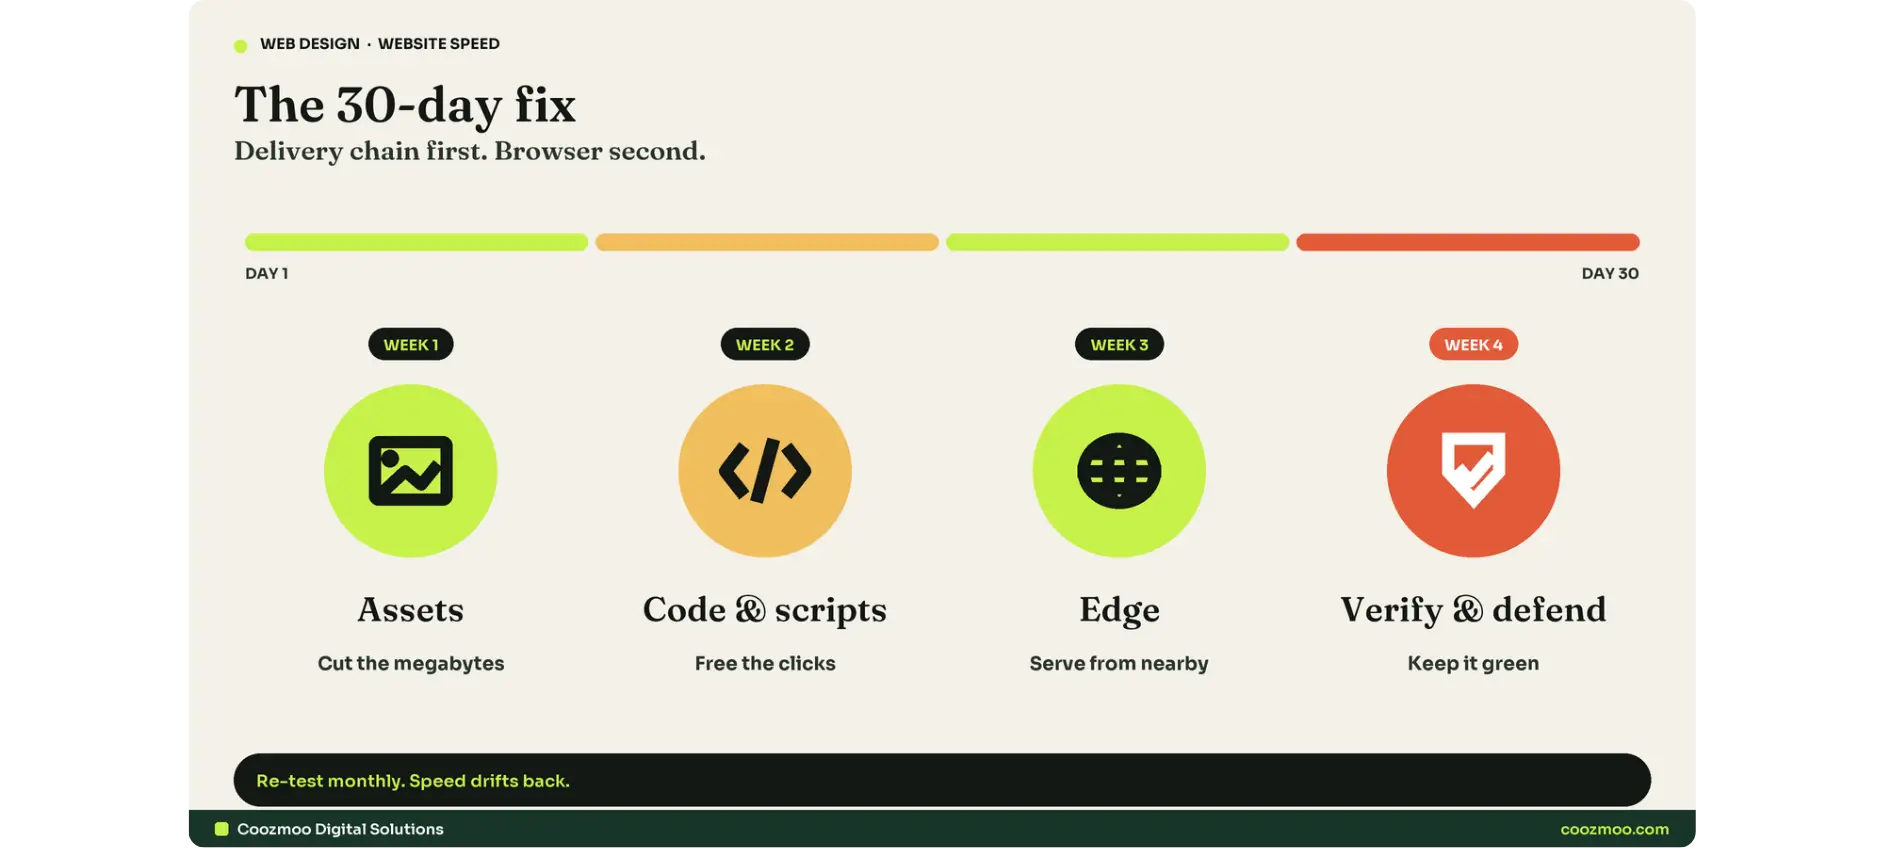

S: Snapshot (day 0, already done)
The Snapshot is the before picture of your site, and you took it in the five-minute diagnostic above. It captures four things: the field data and lab scores for your homepage and your three most important pages, the numbers behind them (LCP, INP, CLS, TTFB), the URL groups Search Console flags as failing, and the date you recorded them. Keep it as a screenshot or a spreadsheet row, not a memory.
Then read it twice. First as a diagnosis: a failing LCP points at images, hosting, or render-blocking code, a failing INP points at scripts, and a failing CLS points at layout, and those are three different weeks of work. Second as a control: after every change, re-run the same pages in the same tool and compare them to this baseline. Without the before numbers you cannot tell a fix from a coincidence, and you cannot show anyone that the work was worth paying for.
P: Prioritize (day 1)
P is where you decide what to ignore. Take the seven causes above, mark the ones your snapshot actually proves you have, and rank them by seconds saved per hour of work. Assets and delivery usually sit at the top, cosmetic tweaks at the bottom. Then prioritize by page as well: fix the template behind your money pages before you touch the About page.
Most sites find that two or three causes account for the majority of the load time, so the output of this step is a short fix order, three to five items you will genuinely work through, not a 40-line audit that nobody starts.
E: Eliminate (weeks 1–2)
Week 1: assets. Convert and resize images (WebP, correct dimensions, lazy-load everything below the fold, keep the hero eager with fetchpriority="high"). If a site has not been touched in years, this one week alone often cuts load time in half.
Week 2: code and scripts. List every third-party script in the browser's Network tab. Ask three questions of each: Who owns it, what decision does it drive, and would anyone notice if it stopped loading? Delete or consolidate the rest, then defer what survives. Then minify CSS and JavaScript, and clean the plugin or app list. WordPress teams: this is the plugin audit-for-web-development) the CMS blog post warns you about. Shopify teams: app list first, theme second.
E: Edge (week 3)
Delivery. Confirm your host serves HTTP/2 or HTTP/3, your static assets are on a CDN, browser caching is set, the server compresses with Brotli or gzip, and your fonts are subsetted and preloaded. Cloudflare's speed troubleshooting guide is the cleanest reference here, and it includes the piece most audits miss: check whether a server-side script or worker is adding latency on every request.
D: Defend (week 4 and forever)
Speed does not stay fixed. A new tag manager pixel, a new app, a new section, a new font weight, and the score is gone by Friday. Defend means: re-run the same snapshot monthly, watch the Search Console Core Web Vitals report for new slow URLs, and treat every new tool as a purchase that must justify its cost. If you add one thing, remove one thing.

Platform by Platform: What Is Already Done for You
Half of speed optimization is knowing what your platform already handles, because generic advice can be wrong for your stack.
Platform | Already handled | What you must still do |
|---|---|---|
WordPress (self-hosted) | Nothing automatic | Hosting quality, caching, plugin discipline, image pipeline, theme choice |
Shopify | CDN, HTTP/2, browser caching, gzip, WebP image CDN, minification | App audit, theme choice, tag manager cleanup, section count, pagination |
Wix / Squarespace | Hosting, CDN, caching | Image discipline, third-party embeds, custom code, font count |
Framer | Pre-rendering, edge image optimization, code splitting, predictive preloading | Content weight, embeds, third-party scripts, custom code |
Custom / headless | Depends on the build | Everything, plus rendering strategy and API caching |
The Shopify row deserves a note, because generic audit tools love to recommend things Shopify already runs. Shopify's web performance documentation is explicit: server-level recommendations about headers, caching, compression, and CDNs mostly do not apply. The real levers on Shopify are apps, theme, and third-party code.
Framer is worth knowing about too, because Framer publishes what its stack does: images convert to WebP and AVIF at the edge, pages are pre-rendered, and JavaScript gets split into an optimal number of chunks. In its own published numbers, a bundle change from 67 chunks to 22 moved P75 LCP from 4.5 seconds to 1.1 seconds. That is what code splitting can do when the platform supports it, and it is the answer to "why does the same content load fast on a Framer site and slow on our WordPress site?"
The 2026 Twist: Bots, AI Crawlers, and Your Server
Here is the part most speed guides do not cover, and it is why this conversation changed.
In mid-2026, Cloudflare Radar data showed automated requests overtook human visitors for the first time. Bots are now the majority of web traffic, and AI crawlers are the fastest-growing slice. Some of those crawlers exist to train models. Some exist to index content for AI search. And some fetch your page in the moment a person asks an AI assistant about you.
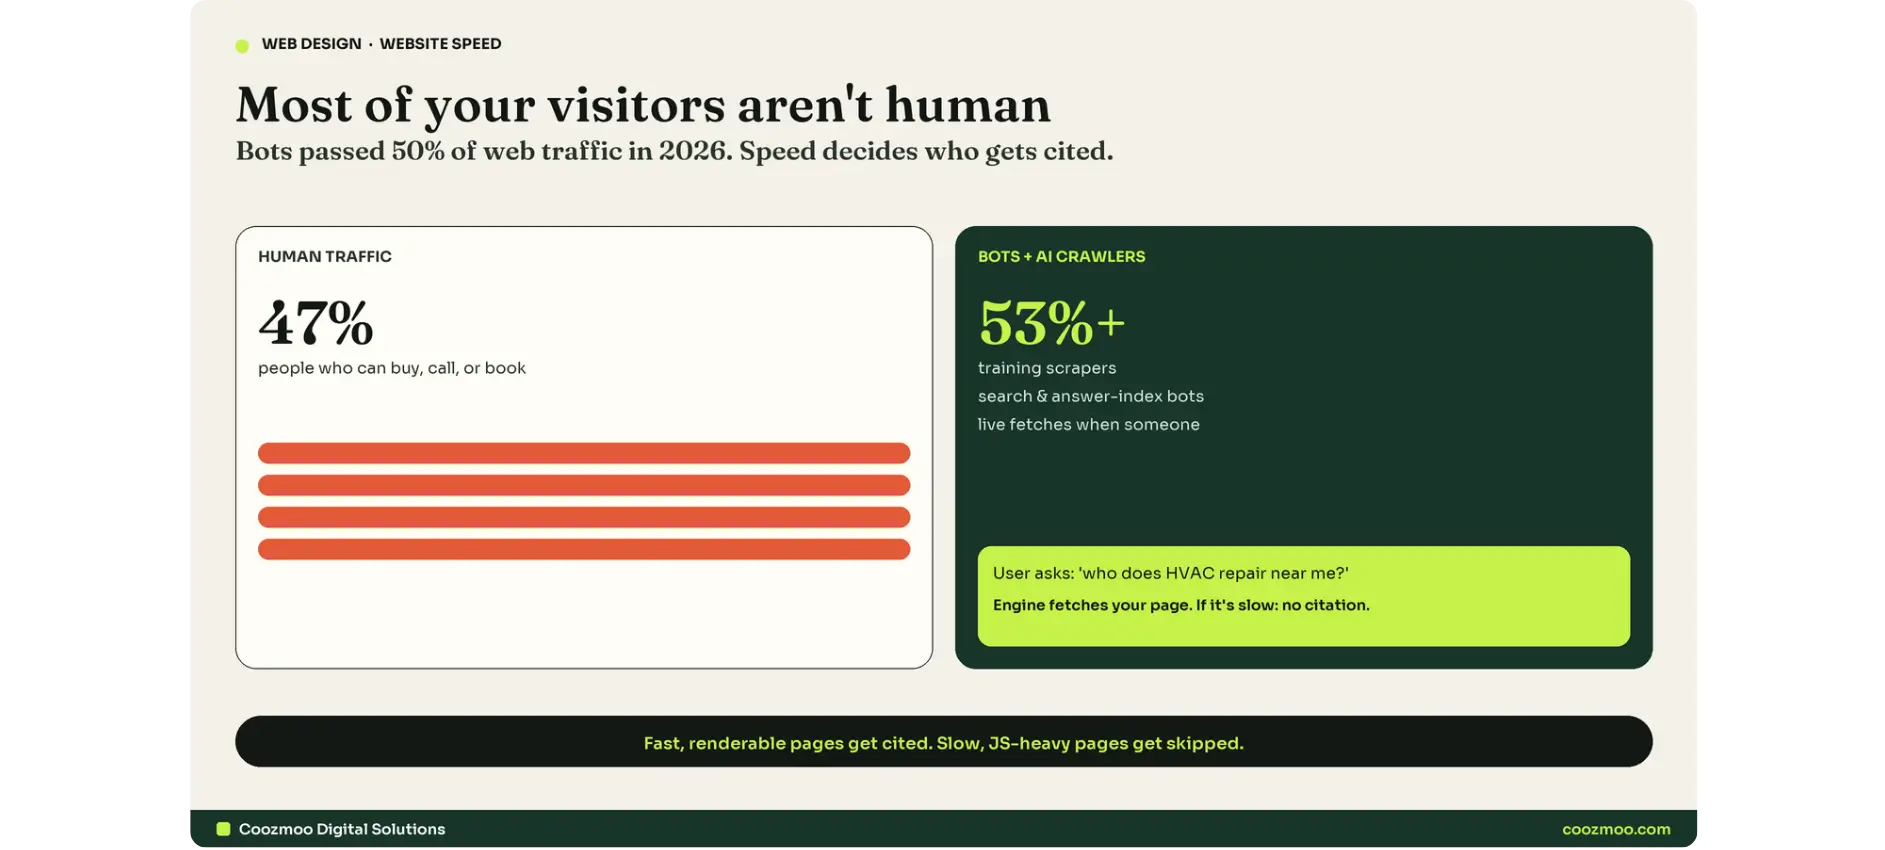
That matters for speed in three concrete ways.
First, your server is working harder than your analytics say. Your analytics only count humans. Your server and your hosting bill count bots too. A slow origin that coped with 500 human visitors a day now serves thousands of extra requests, and that is why sites feel slower in 2026 despite "better" hosting.
Second, answer engines fetch your page live. When someone asks ChatGPT, Gemini, or Perplexity a question about your service, the engine may pull your page in that moment to compose an answer. A page that takes six seconds and renders content only after JavaScript finishes is a page that gets skipped. A page that answers in one second is a page that gets cited. Our clients see this in the same report that shows more than half their website traffic is not human.
Third, not every bot can run JavaScript. Google says server-side rendering or pre-rendering makes your site faster for users and crawlers, and not all bots can run JavaScript. A single-page app that renders everything client-side is not just slow for humans. It is invisible to parts of the AI search pipeline.
This does not mean you should block AI crawlers. Blocking retrieval bots removes you from ChatGPT and Perplexity answers entirely, and AI-referred visits to US retailers grew nearly 400 percent year over year in early 2026, with those visitors engaging more deeply than average. The move is not to block. The move is to be fast enough, and renderable enough, to be worth fetching. For the full crawl policy conversation, see our guide to AI crawlers vs traditional crawlers.

What Speed Is Actually Worth
Now the part that gets you to open a ticket with your developer.
In the Deloitte study Milliseconds Make Millions, a 0.1 second improvement across four speed metrics produced:
Retail: 8.4 percent more conversions, 9.2 percent more spend per order, and a 9.1 percent jump from product page to add-to-basket.
Lead generation: 21.6 percent more visitors reaching the form submission page.
Travel: 10 percent more bookings, 2.2 percent more completed checkouts.
Read that again. Not a one-second fix. One-tenth of a second, across the whole journey, on every page. That is why the SPEED method prioritizes the chain instead of polishing one image.
The other story is the state of the web. In the HTTP Archive's 2025 Web Almanac performance chapter, only 48 percent of mobile sites and 56 percent of desktop sites had good Core Web Vitals. That is up from 32 and 41 percent in 2021, but it still means about half the web is failing, including plenty of well-funded competitors. Fast is an advantage today because slow is still normal.
When to Optimize vs. When to Rebuild
Some sites should not be optimized. They should be rebuilt. The honest signposts:
Optimization fixes keep failing because the theme or platform cannot support them.
The site runs on a page builder that loads 200 KB of code to render two paragraphs.
Two teams have patched the same template, and nobody wants to touch it.
Every new marketing request requires a workaround.
Security updates and backups are the owner's job every week.
If that sounds like your site, a website redesign with a performance-first platform will cost less over two years than the endless patching, and it will convert better because the whole experience is rebuilt. If none of that is true, optimize what you have. Rebuilding a healthy site to chase a score is a waste.
What to Do This Week
Run PageSpeed Insights on your homepage and three money pages. Save the results.
Open Search Console → Core Web Vitals and note the URL groups failing.
Open the browser Network tab on your homepage, sort by size, and count the images over 300 KB.
List every third-party script and every plugin or app. Ask what decision each one drives. Delete the ones without an answer.
That is more progress than a month of "is my website too slow" anxiety. Then re-test. Your baseline number goes down, your form submissions go up, and the next time someone asks whether your site is slow, you have proof.
When you want a second set of hands, run the free page speed checker, see the score, and request a free web design proposal or talk to our team. Web design, conversion optimization, and performance live in one team here, not three vendors.
FAQs
Is your website too slow? How do I know?

Load your homepage on real mobile data, not office wifi, and count to three. If the main content is not there by three seconds, yes, it is too slow. Then confirm with the field data in PageSpeed Insights or the Core Web Vitals report in Search Console. LCP over 2.5 seconds, INP over 200 milliseconds, or CLS over 0.10 at the 75th percentile means a failing score.
Why is my website slow all of a sudden?
Something changed recently: a new plugin or app, a tag added to the tag manager, an embedded widget, a theme update, a traffic spike, or a coworker's 4,000-pixel image upload. Check the Network tab for what loads on every page now, or use your hosting logs to see if a resource is timing out.
What is a good website load time?
In Core Web Vitals terms: main content within 2.5 seconds (LCP), response to interaction within 200 milliseconds (INP), and no layout shift above 0.10 (CLS). Using total load time alone hides the truth, because a page can "fully load" in four seconds while the visitor saw nothing useful until 3.
Do big images really slow down a website that much?
Yes, they are the single most common cause. A single 4 MB JPEG can be most of the page weight. WebP or AVIF conversion, resizing to display dimensions, and lazy loading below the fold usually cut image weight by half or more without visible quality loss. Image optimization can help reduce unnecessary page weight.
Is my hosting the problem or my website?
Check Time to First Byte. Over 800 ms means the server is the problem. Under 800 ms with a slow page means the page itself is the problem: images, scripts, or plugins. Two tools solve this: the TTFB section in PageSpeed Insights and the Network tab in Chrome, which shows time to first byte per request.
Is your website too slow? Probably. And you already know, even if you have not looked at a single performance report. That page that takes a breath before the text appears. The form you click twice because the button has not woken up yet. The mobile visitor who was looking at your prices and is now reading a competitor's blog.
Most business owners answer this question with a feeling. This guide gives you a different answer: a diagnosis you can run in five minutes, the seven causes that produce almost every slow site, a 30-day fix order, and the reason speed matters more in 2026 than it did five years ago. Most of what slows a site down was decided while it was being built, which is why speed belongs inside web design rather than in a cleanup pass at the end.
This is the same diagnostic loop our team uses on client sites at Coozmoo Digital Solutions, and it is built to be run by someone who has never opened Chrome DevTools. If you follow it, you will stop guessing and start fixing.
Is Your Website Too Slow? The 5-Minute Diagnostic
Do not start by deleting plugins. Start by measuring, because the fix that works for one slow site is useless on another. Two sites can both take six seconds to load. One has a 4 MB hero image. The other has a slow server and forty third-party scripts. The day-2 actions are completely different.
Here is the honest version of a speed test, because most guides skip it: there are two kinds of numbers, and only one of them counts.
Lab data comes from tools like PageSpeed Insights and Lighthouse. One simulated visit, fixed network, fixed device. Great for debugging, useless as a verdict.
Field data comes from real visitors on real phones, real wifi, and real 4G. Google collects it from Chrome users and publishes it in the Chrome User Experience Report. This is what Google's ranking systems actually look at.
That is why a site can score 98 in a lab test while customers still complain. Your test ran on a desktop connection. Your customers did not.
The numbers that matter
Google's Core Web Vitals are three measurements of how a page feels, not how heavy it is. Good means the metric passes for at least 75 percent of real page loads, so your slowest visitors are part of the score whether you like it or not.
Metric | What it measures | Good | Needs work | Poor |
|---|---|---|---|---|
LCP Largest Contentful Paint | How fast the main content appears | ≤ 2.5 s | 2.5–4.0 s | > 4.0 s |
INP Interaction to Next Paint | How fast the page reacts to taps and clicks | < 200 ms | 200–500 ms | > 500 ms |
CLS Cumulative Layout Shift | How much the layout jumps while loading | ≤ 0.10 | 0.10–0.25 | > 0.25 |
TTFB Time to First Byte | How fast the server answers | < 800 ms | 800–1,800 ms | higher |
FCP First Contentful Paint | When the first content shows | < 1.8 s | 1.8–3.0 s | higher |
One more thing to know, because it saves a lot of wasted effort: Google says page experience is not a magic ranking lever. Core Web Vitals are used by ranking systems, but a perfect score does not push thin content up the page. Speed is a support signal and a conversion problem, not a substitute for a good site. The people selling you "rank #1 by fixing PageSpeed" are selling you a score.
Run the snapshot
Open PageSpeed Insights on your homepage and your three most important pages. Note the Field data section first. If it says "no field data", the site does not have enough traffic yet, so use lab data as your baseline and check again in two weeks.
Open Search Console, go to Core Web Vitals, and sort by the number of URLs affected. Google is telling you which templates are the problem. If every slow URL is a product page, the fix is the product template, not the homepage.
On your phone, with wifi off, open your homepage and count. If the first real content is not there by the time you have read the word "hello", mobile visitors are leaving before your brand name loads.
That is your Snapshot. Write down the numbers. You will need them to prove the fix worked.
Want a second measurement from a different machine? Run the free page speed checker on the same URLs. Two tools disagreeing is normal. Two tools both saying "this is slow" is a problem.
Why Is Your Website Slow? The 7 Real Causes
Every slow website we audit fits into one of seven buckets. Almost every slow website fits into three or four.
If six seconds is disappearing somewhere, here is where the seconds actually go, and it is not one place. Google's own LCP optimization guide breaks the metric into four parts: the time before the important resource even starts loading, the download time for that resource, the delay before it can render, and the server's time to first byte. Speed problems hide in each of them.
Now the seven causes, in the order we check them.
1. Images and video that are too big
The most common cause, and the easiest win. A 4,000-pixel-wide JPEG from a camera roll, served at 300 pixels wide, costs the visitor the full file size of the big one. Photographs should be served as WebP or AVIF, resized to the dimensions they actually display at, and usually under 200 KB. Product galleries and hero banners are where the money hides.
Metric attacked: LCP.
Owner: whoever uploads content.
2. JavaScript and third-party scripts
Every chat widget, analytics tag, ad pixel, review badge, and personalization script is a file your browser must download and run, and most of them run before your headline has a chance to show. Heavy JavaScript is the single biggest cause of poor INP, the metric that makes a page feel frozen after it has "loaded".
Metric attacked: INP mostly, LCP when scripts block rendering.
Owner: marketing operations plus development.
3. Hosting and server response
If your server takes 900 ms to answer, nothing you do to images will get you under 2.5 seconds. Shared hosting means your site shares resources with hundreds of others, and one neighbor's traffic spike can slow you down. Look for an average server response under 200 ms and a time to first byte under 800 ms.
Metric attacked: TTFB, which feeds LCP and FCP.
Owner: the host, then your developer.
4. Plugins, apps, and heavy themes
On WordPress, every active plugin adds code whether or not a visitor uses the feature. On Shopify, the same rule applies to apps. A theme with page transitions, sliders, and a bundled portfolio is rarely faster than a clean one. If a plugin or app does not measurably help revenue, it is a tax.
Metric attacked: everything, which is why app bloat is the classic "why is my website slow all of a sudden" answer.
Owner: site admin.
5. Web fonts
Custom fonts can block rendering until they download, and a badly configured font causes the text to swap mid-read, which is a layout shift. Subset the font to the characters you actually use, preload the ones above the fold, and set font-display: swap so readers see text immediately.
Metric attacked: LCP and CLS.
Owner: design plus development.
6. Missing caching and CDN
Browser caching stores static files on the visitor's device so repeat visits are nearly instant. A CDN stores copies of files on servers around the world so a visitor in Denver is not fetching from a server in Dallas or Dubai. Both are configuration, not code, and both are usually already included in modern platforms.
Metric attacked: LCP and TTFB for distant visitors.
Owner: host or platform.
7. Layout shock
Page layout shifts when an ad loads, a popup appears, a carousel spins, or an image has no reserved space. The visitor's finger is about to tap the "Book now" button and it moves down 40 pixels. The tap lands on something else. That is a CLS problem, and it is invisible in a screenshot but very visible in your form abandonment rate.
Metric attacked: CLS.
Owner: design plus whoever runs the popups.
What this looks like in one table?
Cause | Symptom you will recognize | Metric | Owner |
|---|---|---|---|
Big images / video | "The picture is the last thing to load" | LCP | Content team |
Heavy JS / third-party scripts | "Page loads but I cannot click for 3 seconds" | INP | Marketing ops + dev |
Slow hosting | "It is slow for everyone, everywhere" | TTFB | Host / dev |
Plugin or app bloat | "It got slower after we added things" | All three | Site admin |
Web fonts | "Text appears then changes font" | LCP, CLS | Design + dev |
No caching / CDN | "Fast at home, slow at the office" | LCP, TTFB | Host / platform |
Layout shock | "Buttons move while I am clicking" | CLS | Design + popup owner |
How to Fix a Slow Website: The SPEED Method
Now the order. The order matters more than the list, because the biggest wins come from the delivery chain, not from deleting one plugin.
S: Snapshot (day 0, already done)
The Snapshot is the before picture of your site, and you took it in the five-minute diagnostic above. It captures four things: the field data and lab scores for your homepage and your three most important pages, the numbers behind them (LCP, INP, CLS, TTFB), the URL groups Search Console flags as failing, and the date you recorded them. Keep it as a screenshot or a spreadsheet row, not a memory.
Then read it twice. First as a diagnosis: a failing LCP points at images, hosting, or render-blocking code, a failing INP points at scripts, and a failing CLS points at layout, and those are three different weeks of work. Second as a control: after every change, re-run the same pages in the same tool and compare them to this baseline. Without the before numbers you cannot tell a fix from a coincidence, and you cannot show anyone that the work was worth paying for.
P: Prioritize (day 1)
P is where you decide what to ignore. Take the seven causes above, mark the ones your snapshot actually proves you have, and rank them by seconds saved per hour of work. Assets and delivery usually sit at the top, cosmetic tweaks at the bottom. Then prioritize by page as well: fix the template behind your money pages before you touch the About page.
Most sites find that two or three causes account for the majority of the load time, so the output of this step is a short fix order, three to five items you will genuinely work through, not a 40-line audit that nobody starts.
E: Eliminate (weeks 1–2)
Week 1: assets. Convert and resize images (WebP, correct dimensions, lazy-load everything below the fold, keep the hero eager with fetchpriority="high"). If a site has not been touched in years, this one week alone often cuts load time in half.
Week 2: code and scripts. List every third-party script in the browser's Network tab. Ask three questions of each: Who owns it, what decision does it drive, and would anyone notice if it stopped loading? Delete or consolidate the rest, then defer what survives. Then minify CSS and JavaScript, and clean the plugin or app list. WordPress teams: this is the plugin audit-for-web-development) the CMS blog post warns you about. Shopify teams: app list first, theme second.
E: Edge (week 3)
Delivery. Confirm your host serves HTTP/2 or HTTP/3, your static assets are on a CDN, browser caching is set, the server compresses with Brotli or gzip, and your fonts are subsetted and preloaded. Cloudflare's speed troubleshooting guide is the cleanest reference here, and it includes the piece most audits miss: check whether a server-side script or worker is adding latency on every request.
D: Defend (week 4 and forever)
Speed does not stay fixed. A new tag manager pixel, a new app, a new section, a new font weight, and the score is gone by Friday. Defend means: re-run the same snapshot monthly, watch the Search Console Core Web Vitals report for new slow URLs, and treat every new tool as a purchase that must justify its cost. If you add one thing, remove one thing.
Platform by Platform: What Is Already Done for You
Half of speed optimization is knowing what your platform already handles, because generic advice can be wrong for your stack.
Platform | Already handled | What you must still do |
|---|---|---|
WordPress (self-hosted) | Nothing automatic | Hosting quality, caching, plugin discipline, image pipeline, theme choice |
Shopify | CDN, HTTP/2, browser caching, gzip, WebP image CDN, minification | App audit, theme choice, tag manager cleanup, section count, pagination |
Wix / Squarespace | Hosting, CDN, caching | Image discipline, third-party embeds, custom code, font count |
Framer | Pre-rendering, edge image optimization, code splitting, predictive preloading | Content weight, embeds, third-party scripts, custom code |
Custom / headless | Depends on the build | Everything, plus rendering strategy and API caching |
The Shopify row deserves a note, because generic audit tools love to recommend things Shopify already runs. Shopify's web performance documentation is explicit: server-level recommendations about headers, caching, compression, and CDNs mostly do not apply. The real levers on Shopify are apps, theme, and third-party code.
Framer is worth knowing about too, because Framer publishes what its stack does: images convert to WebP and AVIF at the edge, pages are pre-rendered, and JavaScript gets split into an optimal number of chunks. In its own published numbers, a bundle change from 67 chunks to 22 moved P75 LCP from 4.5 seconds to 1.1 seconds. That is what code splitting can do when the platform supports it, and it is the answer to "why does the same content load fast on a Framer site and slow on our WordPress site?"
The 2026 Twist: Bots, AI Crawlers, and Your Server
Here is the part most speed guides do not cover, and it is why this conversation changed.
In mid-2026, Cloudflare Radar data showed automated requests overtook human visitors for the first time. Bots are now the majority of web traffic, and AI crawlers are the fastest-growing slice. Some of those crawlers exist to train models. Some exist to index content for AI search. And some fetch your page in the moment a person asks an AI assistant about you.
That matters for speed in three concrete ways.
First, your server is working harder than your analytics say. Your analytics only count humans. Your server and your hosting bill count bots too. A slow origin that coped with 500 human visitors a day now serves thousands of extra requests, and that is why sites feel slower in 2026 despite "better" hosting.
Second, answer engines fetch your page live. When someone asks ChatGPT, Gemini, or Perplexity a question about your service, the engine may pull your page in that moment to compose an answer. A page that takes six seconds and renders content only after JavaScript finishes is a page that gets skipped. A page that answers in one second is a page that gets cited. Our clients see this in the same report that shows more than half their website traffic is not human.
Third, not every bot can run JavaScript. Google says server-side rendering or pre-rendering makes your site faster for users and crawlers, and not all bots can run JavaScript. A single-page app that renders everything client-side is not just slow for humans. It is invisible to parts of the AI search pipeline.
This does not mean you should block AI crawlers. Blocking retrieval bots removes you from ChatGPT and Perplexity answers entirely, and AI-referred visits to US retailers grew nearly 400 percent year over year in early 2026, with those visitors engaging more deeply than average. The move is not to block. The move is to be fast enough, and renderable enough, to be worth fetching. For the full crawl policy conversation, see our guide to AI crawlers vs traditional crawlers.
What Speed Is Actually Worth
Now the part that gets you to open a ticket with your developer.
In the Deloitte study Milliseconds Make Millions, a 0.1 second improvement across four speed metrics produced:
Retail: 8.4 percent more conversions, 9.2 percent more spend per order, and a 9.1 percent jump from product page to add-to-basket.
Lead generation: 21.6 percent more visitors reaching the form submission page.
Travel: 10 percent more bookings, 2.2 percent more completed checkouts.
Read that again. Not a one-second fix. One-tenth of a second, across the whole journey, on every page. That is why the SPEED method prioritizes the chain instead of polishing one image.
The other story is the state of the web. In the HTTP Archive's 2025 Web Almanac performance chapter, only 48 percent of mobile sites and 56 percent of desktop sites had good Core Web Vitals. That is up from 32 and 41 percent in 2021, but it still means about half the web is failing, including plenty of well-funded competitors. Fast is an advantage today because slow is still normal.
When to Optimize vs. When to Rebuild
Some sites should not be optimized. They should be rebuilt. The honest signposts:
Optimization fixes keep failing because the theme or platform cannot support them.
The site runs on a page builder that loads 200 KB of code to render two paragraphs.
Two teams have patched the same template, and nobody wants to touch it.
Every new marketing request requires a workaround.
Security updates and backups are the owner's job every week.
If that sounds like your site, a website redesign with a performance-first platform will cost less over two years than the endless patching, and it will convert better because the whole experience is rebuilt. If none of that is true, optimize what you have. Rebuilding a healthy site to chase a score is a waste.
What to Do This Week
Run PageSpeed Insights on your homepage and three money pages. Save the results.
Open Search Console → Core Web Vitals and note the URL groups failing.
Open the browser Network tab on your homepage, sort by size, and count the images over 300 KB.
List every third-party script and every plugin or app. Ask what decision each one drives. Delete the ones without an answer.
That is more progress than a month of "is my website too slow" anxiety. Then re-test. Your baseline number goes down, your form submissions go up, and the next time someone asks whether your site is slow, you have proof.
When you want a second set of hands, run the free page speed checker, see the score, and request a free web design proposal or talk to our team. Web design, conversion optimization, and performance live in one team here, not three vendors.
FAQs
Is your website too slow? How do I know?
Load your homepage on real mobile data, not office wifi, and count to three. If the main content is not there by three seconds, yes, it is too slow. Then confirm with the field data in PageSpeed Insights or the Core Web Vitals report in Search Console. LCP over 2.5 seconds, INP over 200 milliseconds, or CLS over 0.10 at the 75th percentile means a failing score.
Why is my website slow all of a sudden?
Something changed recently: a new plugin or app, a tag added to the tag manager, an embedded widget, a theme update, a traffic spike, or a coworker's 4,000-pixel image upload. Check the Network tab for what loads on every page now, or use your hosting logs to see if a resource is timing out.
What is a good website load time?
In Core Web Vitals terms: main content within 2.5 seconds (LCP), response to interaction within 200 milliseconds (INP), and no layout shift above 0.10 (CLS). Using total load time alone hides the truth, because a page can "fully load" in four seconds while the visitor saw nothing useful until 3.
Do big images really slow down a website that much?
Yes, they are the single most common cause. A single 4 MB JPEG can be most of the page weight. WebP or AVIF conversion, resizing to display dimensions, and lazy loading below the fold usually cut image weight by half or more without visible quality loss. Image optimization can help reduce unnecessary page weight.
Is my hosting the problem or my website?
Check Time to First Byte. Over 800 ms means the server is the problem. Under 800 ms with a slow page means the page itself is the problem: images, scripts, or plugins. Two tools solve this: the TTFB section in PageSpeed Insights and the Network tab in Chrome, which shows time to first byte per request.

Nikhil Burani
,
Nikhil Burani

Summarize with AI










Don’t miss our revenue growth tips!
Get expert marketing tips—straight to your inbox, like thousands of happy clients.
Don’t miss our revenue growth tips!
Don’t miss our revenue growth tips!
Get expert marketing tips—straight to your inbox, like thousands of happy clients.
Don’t miss our revenue growth tips!
Get expert marketing tips—straight to your inbox, like thousands of happy clients.
Relevant Blogs on Web Design
Relevant Blogs on Web Design
Unlock data-driven insights in Web Design—explore our featured blogs and skyrocket your revenue before your competitors do.
Unlock data-driven insights in Web Design—explore our featured blogs and skyrocket your revenue before your competitors do.

Web Design
Jul 23, 2026
8 Min Read
Top 5 AI Web Design Agencies for High-Converting Websites in Houston
Web Design
Jul 23, 2026
8 Min Read
Top 5 AI Web Design Agencies for High-Converting Websites in Houston
Web Design
Jul 23, 2026
8 Min Read
Top 5 AI Web Design Agencies for High-Converting Websites in Houston

Web Design
Jul 21, 2026
10 Min Read
Shopify's New AI Marketing Tool: Should Small Businesses Use It?
Web Design
Jul 21, 2026
10 Min Read
Shopify's New AI Marketing Tool: Should Small Businesses Use It?
Web Design
Jul 21, 2026
10 Min Read
Shopify's New AI Marketing Tool: Should Small Businesses Use It?

Web Design
Jul 14, 2026
10 Min Read
AI Search Sends You a Different Visitor — Is Your Website Built for Them?
Web Design
Jul 14, 2026
10 Min Read
AI Search Sends You a Different Visitor — Is Your Website Built for Them?
Web Design
Jul 14, 2026
10 Min Read
AI Search Sends You a Different Visitor — Is Your Website Built for Them?



































Ready to speak with an expert?
Data-Driven Marketing Agency That Elevates ROI
1100+
Websites Designed & Optimized to Convert
$280M+
Client Revenue Driven & Growing Strong
Discover how to skyrocket
your revenue today!



Trusted by 1000+ Owners!
Ready to speak with an expert?
Data-Driven Marketing Agency That Elevates ROI
1100+
Websites Designed & Optimized to Convert
$280M+
Client Revenue Driven & Growing Strong
Discover how to skyrocket
your revenue today!
Trusted by 1000+ Owners!
Want to skyrocket revenue?
4.9/5 Ratings!
Ready to speak with an expert?
Data-Driven Marketing Agency That Elevates ROI
1100+
Websites Designed & Optimized to Convert
$280M+
Client Revenue Driven & Growing Strong
Discover how to skyrocket
your revenue today!
Trusted by 1000+ Owners!
Call
Meet